
This project covers the setting up and configuration of the VA3HDL Ham Dashboard. It is a simple multi-screen display that can be used to show various amateur radio related and non-amateur radio related displays.
Go to the Github page at github.com/VA3HDL/hamdashboard. Download the code and unzip it. Open and edit the config.js file. You can modify the "top bar center text" for your information. Scroll down to line 63 "aIMG". This is where you set up the tiles visible on screen when you open index.html on your web browser. There are many other ways to customize the program but for the purposes of this video, we'll only cover how to modify the displayed tiles.
The structure of each tile is as follows:
The first item is the name that is displayed in the tile, and the second is the link to the resource you wish to display in the tile. You can rotate tiles in the same spot to allow more information to be displayed. To do this, the tile structure may look like this:
You can set the rotation interval to each tile by scrolling down to find the tileDelay variable, finding the tile location, and setting the interval in milliseconds.
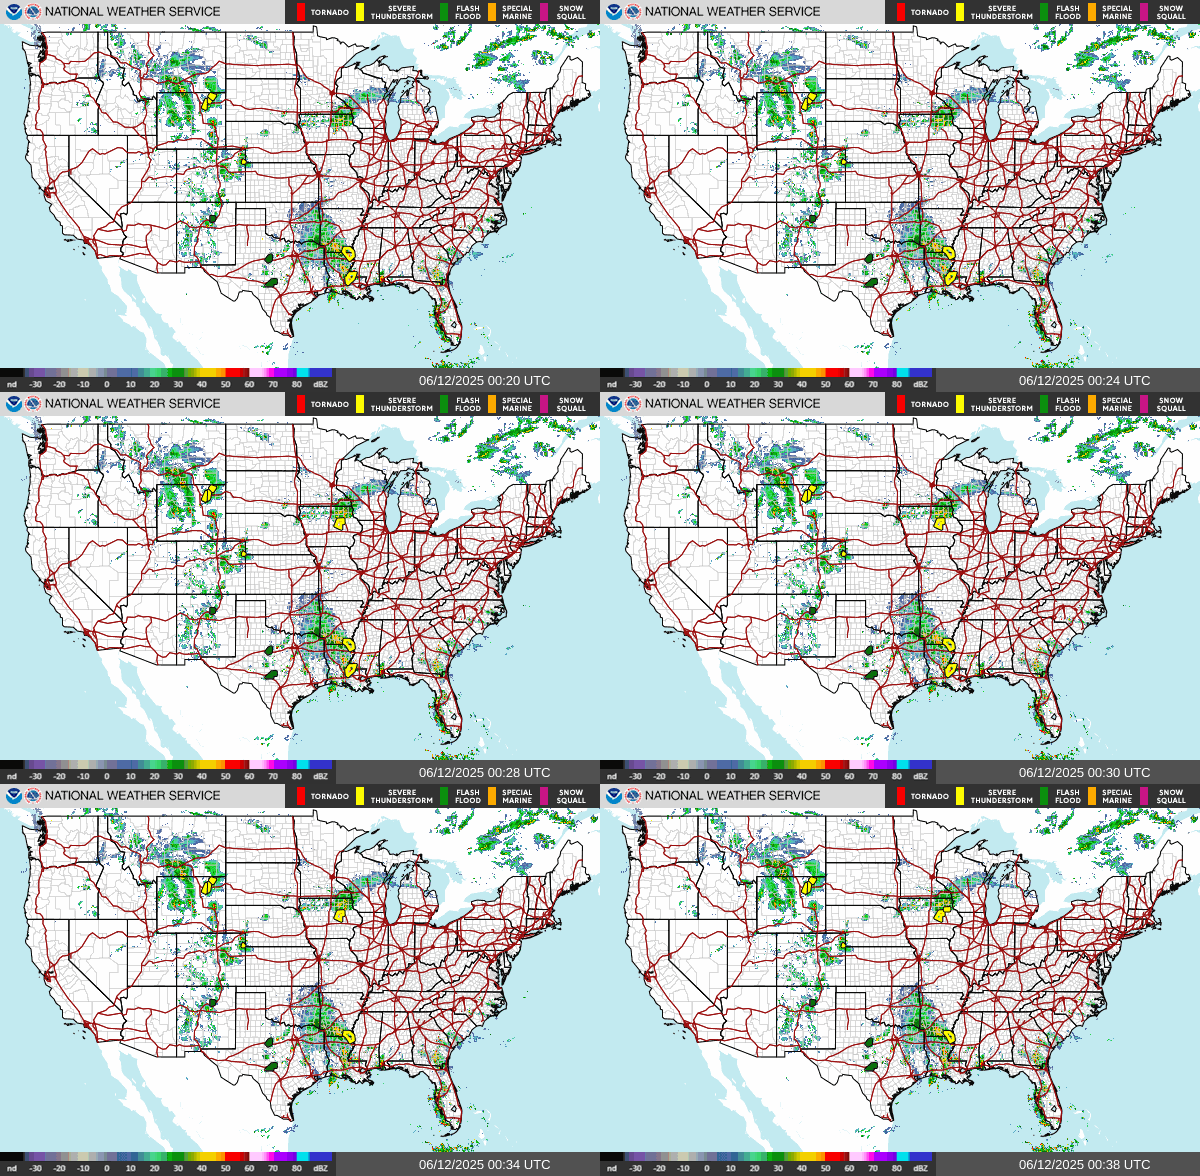
There are a number of types of displays you can use to view the weather. Some of the best ones are the NOAA GOES satellite imaging system and Ridge standard Doppler radar systems. To get images for GOES, go to goes.noaa.gov and figure out which area coverage sector fits your location. Then, select the GeoColor or GLM+GeoColor system, go to "download images" and scroll down to find the gif link and copy it to the tile resource section in the config.js file.
For the Ridge Standard system, go to radar.weather.gov/ridge/standard. Find your region, or look for your local airport's ICAO code. Similarly, copy the gif link to the tile resource section in the config.js file.
Below are examples of the two image systems.
Traffic cams are dependent on your area. If you live in a rural area, you might not be able to find any. Otherwise, you should be able to find some if you search up traffic cams for your city. Find the image link that is continuously updated, and copy that to tile link in the config.js file.
There are a couple other displays you can use. For example, for amateur radio you can get the N0NBH indicators for HF propagation. I use the Solar 101 VHF display, as shown below.
You can view local aircraft traffic using the ADS-B Exchange tool. Simply use
iframe|https://globe.adsbexchange.com/?airport=(your airport code). The iframe| is to indicate the
link leads to a web page and not an image.